Introduction
Thinking of avoiding traffics in rush hour in a busy city?
Searching for ways to fortifying a healthy lifestyle?
Trying to reduce carbon emission towards a green world?
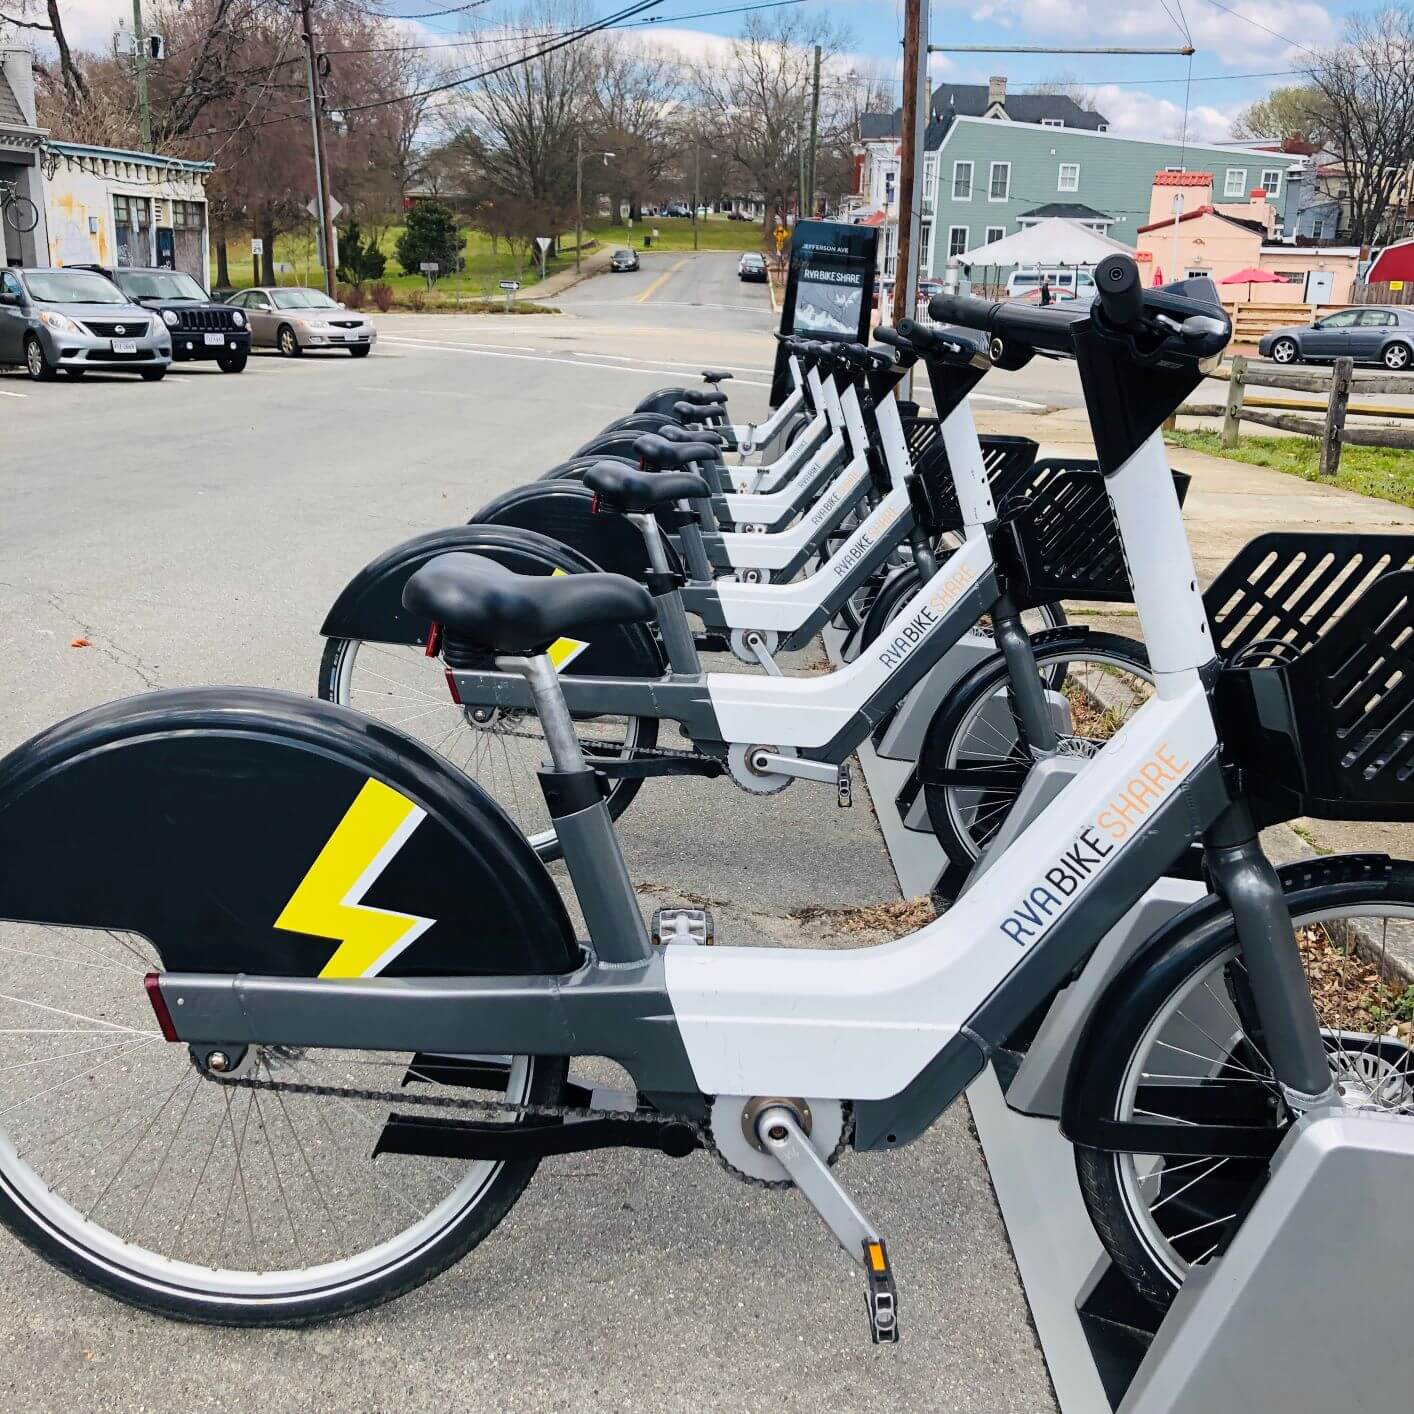
All of these questions have a commoon answer- a ride with two wheels, bikes. From recreational purposes to daily commute the usages of bike are many. With the rise of e-bikes in recent years, the overall biking activity has increased in city areas. So here we visualize rental bike usage data over 9 months in Richmond, VA. The data include the time and stations a bike is rented and returned, as well as the bike GPS locations recorded every few minutes. There are two types of bikes, the regular bikes and pedelec, also known as electric bikes. We have comparison of these two types of bikes in each of our three visualizations. The three visualizations focus on the usage, trips, and stations respectively.
Aggregated Monthly Usage Data
This visualization provides the aggregated view on the monthly bike usages and provides insight into the activity levels of several stations.
Trip Statistics
This visualization explores the correlations between several aspects of bike trips in the city of Richmond.
Station Analysis
This visualization illustrates the heatmap analysis of the routes used by the users.
Richmond Bike Map
The map markers indicate the bike stations in the city of Richmond. We have a total of 23 stations. Bikes and pedelecs are rented from and returned to these stations.